


Project Network Diagrams: Quick Overview of the Powerful Tool

The toolkit of any project manager contains many professional tools, techniques, and frameworks. A network diagram is one of these magical tools that can solve many important tasks in project management.
In simple words, network diagrams visually represent a project’s schedule. Their popular complements include the PERT and Gantt charts. These diagrams are applied whenever project management occurs. Have you ever worked with this powerful tool?
This post will be useful for anyone who wants to know more about the power of project network diagrams, especially those who deal with projects that are complex by nature and include many different and interdependent activities.
What is a Project Network Diagram?
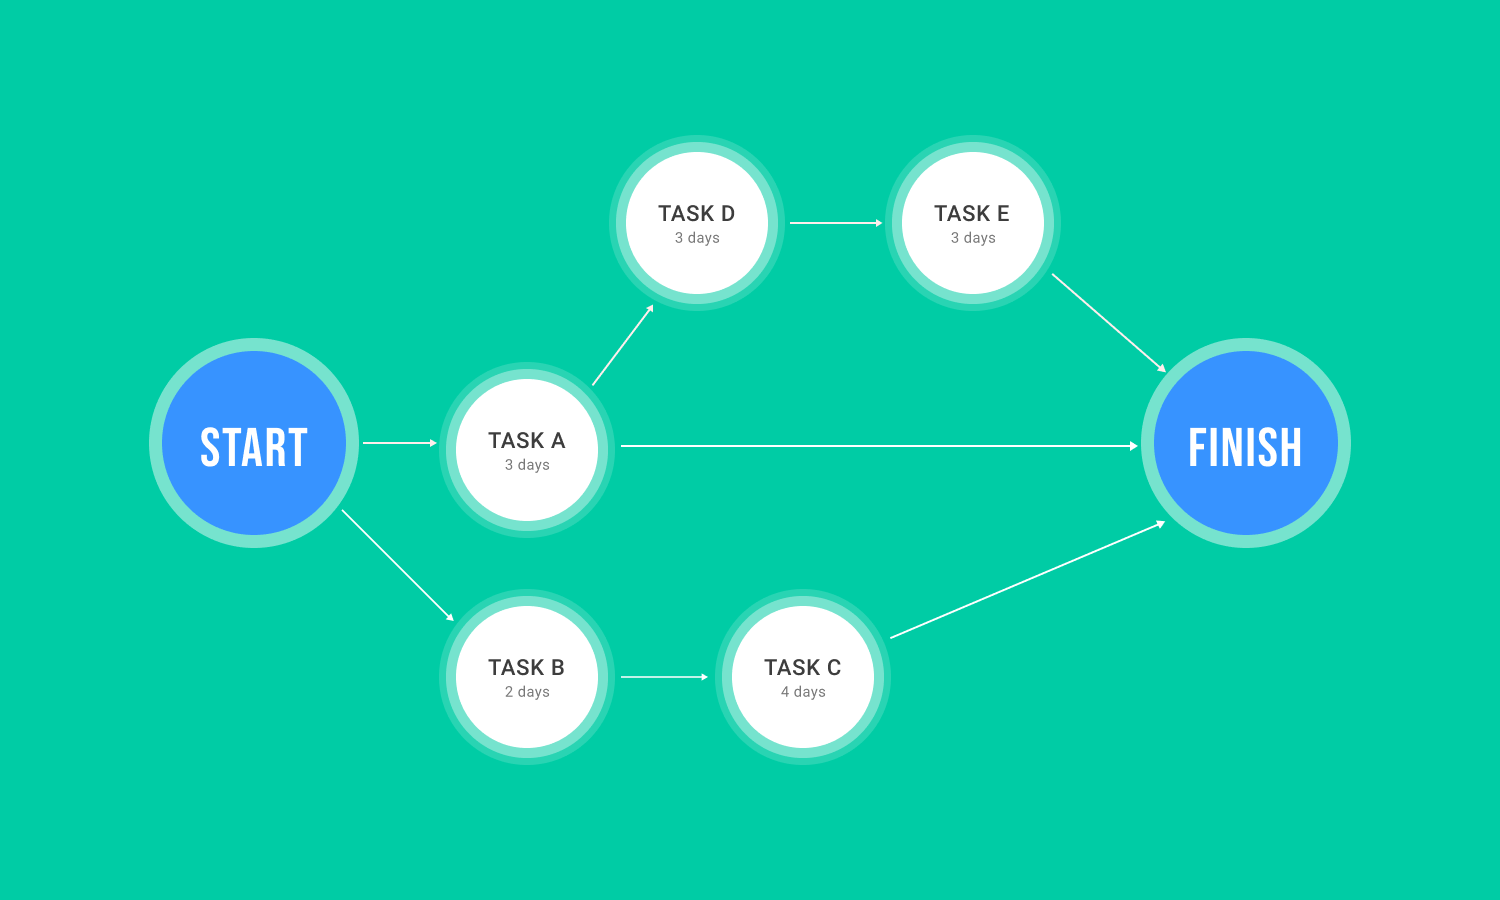
A project network diagram is a visual way to represent the project workflow. It clearly displays the duration of project activities, their chronological order and logical dependencies between the activities (unlike the WBS – work breakdown structure).
This graphic representation is a chart that should be filled with boxes noting tasks and responsibilities, and with arrows that map the schedule and the work sequences. Using the network diagram, you can visually follow the progress of each project phase to its completion.
Project managers all over the world utilize network diagrams to track their projects and see the progress of each element. They can share statuses with their team members. This kind of graphic representation looks especially helpful for individuals who better understand the information in a visual way.
One more obvious profit of a network diagram is its capability to literally illustrate the project’s scope as it collects all the project’s actions and outcomes. A special form of the network diagram is a bar chart. One of the famous ways to visualize such bars is using Gantt Charts.
The Goals of Project Network Diagrams
Network diagrams serve different purposes, some of which are the following:
- Planning a project structure
- Tracking the project progress
- Automatic coordination project updates and changes
- Defining the project workflow
- Identifying bottlenecks and risks
- Documentation (external communication issues)
- Selling a project proposal to stakeholders
- Assistance in justifying the time estimate for the project
- Identifying activity interdependencies
- Showing the progress using a report
Advantages of using network diagrams
Even a young project manager without experience will admit that a network diagram is a boon to project planning. The diagram combines all the tasks that are required to complete the project successfully. It’s very important for project managers to be attentive to details before starting any project, as it will help to identify the critical activities or the time a task can be delayed.
Project network diagrams assist teams in setting deadlines and simplifying the process of ordering material resources and equipment. They also help to manage cash flow and assembling the right team. Moreover, if you are able to see where tasks are dependent on other tasks, you will easily resolve issues as they arise during the project.
Disadvantages of applying project network diagrams
Probably any project management tool has even small limitations. Project network diagrams are not exclusion.
Creating such a diagram takes time and costs money to produce it. Sometimes network diagrams can be too complex and difficult to discern visually. There can also be errors when making it or other factors that can influence.
There are people who simply do not see the necessity of network diagrams. They use Gantt charts that also graphically represent the project timeline with tasks, duration, and dependencies. The only thing we can add here is that tastes really differ.
The Types of Project Network Diagrams
There are many types of network diagrams, but when it comes to project management, you will definitely work with two of them: the AMD diagram (Arrow Diagram Method) and the PDM diagram (Precedence Diagram Method).
ADM: What is Arrow Diagram Method?
The Arrow Diagram Method is aimed to apply arrows for illustrating different activities. This option is rather intuitive.
The arrow tail extrudes from a box (i-node), which represents the starting point of a task. The arrow’s head points towards another box (j-node), which represents the finish point. The length of the arrow means the amount of time spent on the activity. The relationship between nodes can only ever be “start-to-finish”(SF).
- ADM advantages: it is simple to create and understand and does not require formal training.
- ADM drawbacks: you can not lead and lag times without adding new elements into the diagram. For many project managers, it may seem a little simplistic.
PDM: What is the Precedence Diagramming Method?
Nowadays PDM network diagrams are frequently used in project management. PDM means the Precedence Diagramming Method. It is also used for creating project network diagrams, where each box (or node) represents a particular activity. Arrows are used to represent relationships between different activities. They can represent all four possible relationships:
- FS – finish to start. It’s when an activity cannot start before another activity finishes.
- SS – start to start – hen two activities are able to start simultaneously.
- FF – finish to finish – when two tasks need to be finished together.
- SF – start to finish – when one activity cannot finish until another activity starts.
You may write lead time and lag time in alongside the arrows. As a project manager, you will have a clearer idea of scheduling and scope. It will definitely help to report and manage the team.
- PDM advantages: it provides you with a chance to more accurately estimate time and make more informed decisions based on a deep knowledge of each dependency. The diagram will provide optimization both during the project and afterward.
- PDM disadvantages: working with this kind of diagram takes more time than with the simple arrow method. However, it provides you with more accurate and detailed information.
Project Management Software for Making Network Diagrams

There are many smart online tools that can help you to try network diagrams for your project management objectives. Here are some of them:
Google Draw
Google provides us with various tools for all purposes. Google Draw is a free tool that will help you to create beautiful network diagrams, flowcharts, mockups, entity relations, etc. It is best for collaborating work with other Google features.
With the help of Google Draw, you can import files from different formats, use more than 25 languages and share files painlessly. This fast tool has real-time support when connected to a Google account.
Dia
Another friendly solution with an open-source is also used for creating basic project network diagrams. It’s easy to use and able to save XML docs that are reduced automatically to save space. The tool is available for Windows, Linux, and Mac.
Dia provides a good entry-level option for everyone who wants to work with network diagrams, as well as flow charts and UML diagrams.
Gliffy
Some people admit that Giffy’s free version is rather limited. However, if you pay for the full version, you will have a chance to make 200 diagrams (but none of which integrate with Google Drive). The app will not suit if you’re going to build more technical diagrams. However, it looks like a good first step into network diagramming.
The business account for three months includes unlimited diagrams, (but no integration with Google Drive as well).
A network diagram is a good start in project management, but in order to succeed, you will definitely need more than a simple diagram to control the project execution phase.
Therefore we are glad to remind you of a tool that offers full service. With the help of Hygger timelines, based on Gantt chart functionality, you will take your workflows to the next level.
With the help of Hygger roadmaps, you can turn your network diagram into a full-fledged project with Gantt charts that can assign tasks and add durations. You may get more about them studying our related articles and tutorials:
- Special Aspects of Software Development Roadmaps
- How to Make a Product Roadmap from Scratch?
- What is the Concept of an Agile Product Roadmap?
- Project Timeline Templates
- The Ultimate Guide to Gantt Charts
Break your projects into milestones and avoid bottlenecks in your workflow by linking tasks that are dependent on one another.


