


The Ultimate Guide to Gantt Charts

Continuing to learn more and more new ways of work planning, it is possible to forget about some classical methods that were invented a long time ago. As for us, we appreciate our past, and today we want to consider in detail such a technique as the Gantt chart.
In our rich material, we would like to meet you with the subject of Gantt chart, its real purpose, features and advantages. Also, we want to present you some great tools where you can create your own chart and plan your work properly!
The history and purpose of Gantt chart
To begin with, let’s dive a little into the history of the Gantt chart’s creation. Actually, this tool was developed at the beginning of the last century by American engineer Henry Gantt, in honor of whom he got his name. During all its life, the Gantt chart has been successfully using in work planning of different spheres like engineering, construction & development, project management and other industries where clear work planning matters.
Gantt chart serves as a graphical method of planning different tasks and activities – with its horizontal lines, axes and proposed terms, it is considered to be very simple and understandable and helps every person to be productive in work planning and goal setting.
The easier is the better – it is all about the Gantt chart. The structure of this method allows specialists to describe the necessary tasks and set up the desired goals in order to see not only the current work scope but also the sequence of all the tasks. That is, with a proper Gantt chart, it is impossible to forget to execute something from the work, what is really great!
How to create a Gantt chart: user manual
As we mentioned earlier, the Gantt chart is a great and very simple way of planning tasks and different kinds of matters. Despite its simplicity, Gantt chart has some special components and its logistics that are to be executed for the best result in work.
Step 1 – Defining a goal and dividing the whole work into tasks
First of all, it all starts with the process of creating of a table with the original data – there is a certain goal or a project which is going to be implemented with different tasks. That is, before the creation of the Gantt chart itself, a specialist should structure all the activities and make some necessary and required prioritization manipulations.
As a result, there is a real to-do list that further turns into a visual chart.
Step 2 – Indication of time for each task separately and for the whole work entirely
Like any correct to-do list, the tasks in the table for Gantt chart should have their timing or at least approximate terms of execution. For example, a specialist can set the number of hours for the execution of each task, or he can specify a certain fixed period (a week or a number of days/weeks) for the execution of a certain part of work.
It is crucial to note it, because Gantt chart welcomes accuracy and logic in work planning. Besides, the time tracking for each task influences on the entire total result of the work, so every specialist should remember about it in advance!
Step 3 – Layout all data into Gantt chart structure
It is the final stage of Gantt chart composition: all the work planning tasks, with their time and order of execution, are embed into the view of a classical Gantt chart.
The most important components of Gantt chart are definitely tasks – they are presented in the form of horizontal lines, and the length of every such line depends on the duration of the task execution. The vertical lines (axes) imply the terms and periods for the execution of every task and the whole work scope. For convenience’s sake, every complex task can be divided into several small subtasks, and their lines in the chart can be highlighted by one color.
The software for Gantt chart
To be honest, it is not a big deal to make up Gantt charts in some special programs or applications – it becomes possible to create it on paper or on a flip chart. Nevertheless, in order to present Gantt chart to some managers or clients, there are many different ways on how to make it in digital form.
Gantt chart software #1 – Excel
Let’s start our top list of software for Gantt chart with such a common thing as Excel program – it is familiar to almost every user! Here is one example of the table for future Gantt chart that demonstrates some positive features of Excel, as follows:
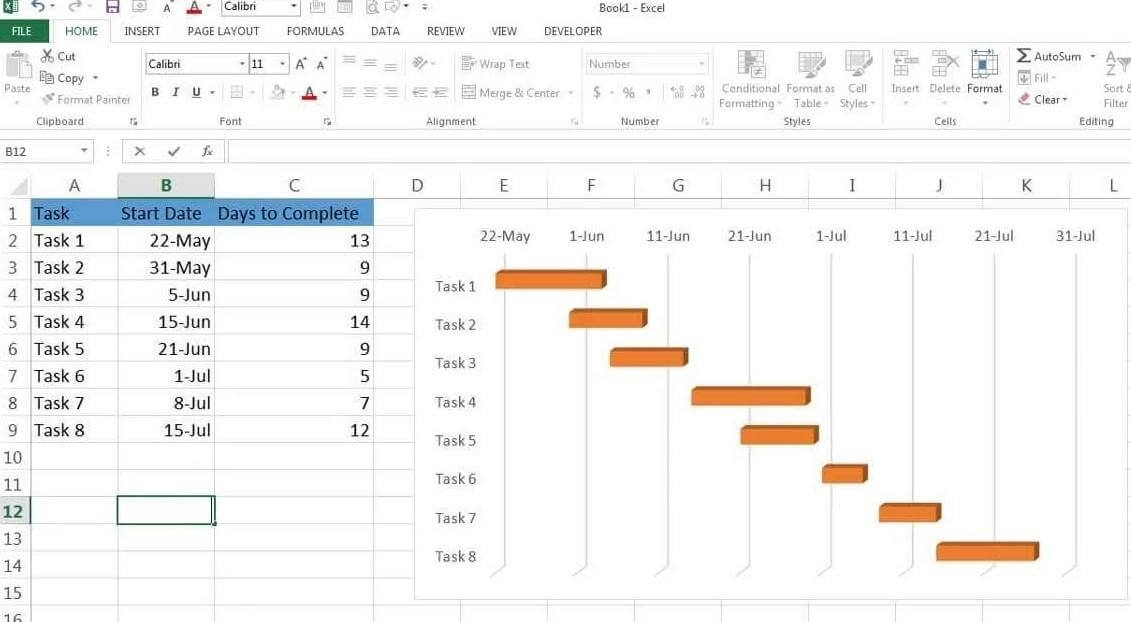
In Excel, there are many useful functions and features like spreadsheets, graphs, macro projects and different formulas that help specialists to make a proper planning.
Gantt chart software #2 – Smartsheet
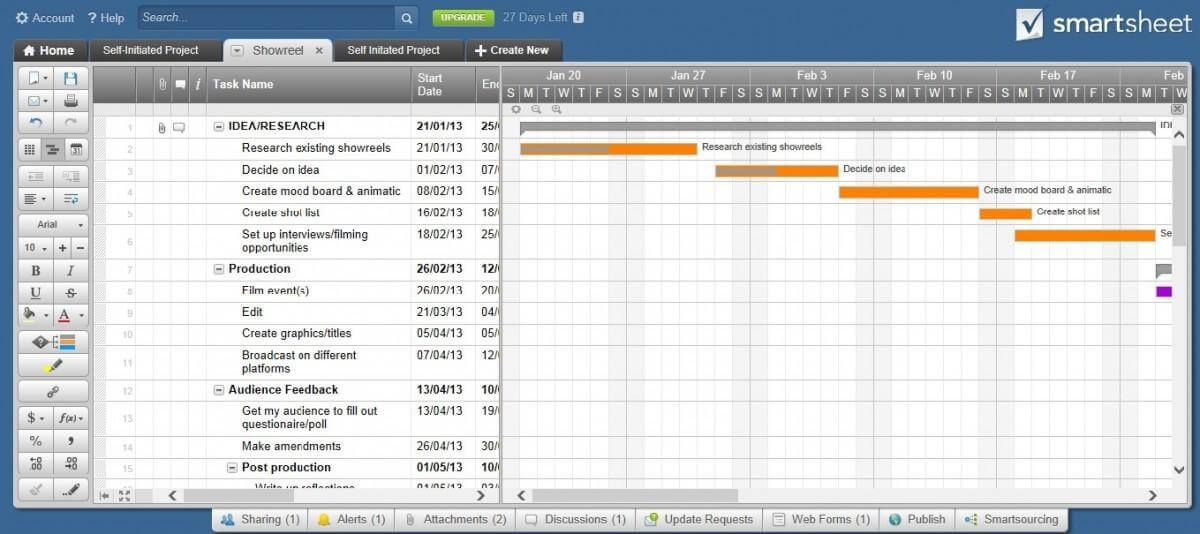
Smartsheet is an independent online application that is considered to be an updated version of Excel. This software is tooled for a simultaneous collaborative work between several employees, a creation of different working documents (tables, graphs, diagrams, etc.) and proper communication. This tool is recommended for different companies with a complex internal structure and a large number of employees.
Gantt chart software #3 – GanttPRO
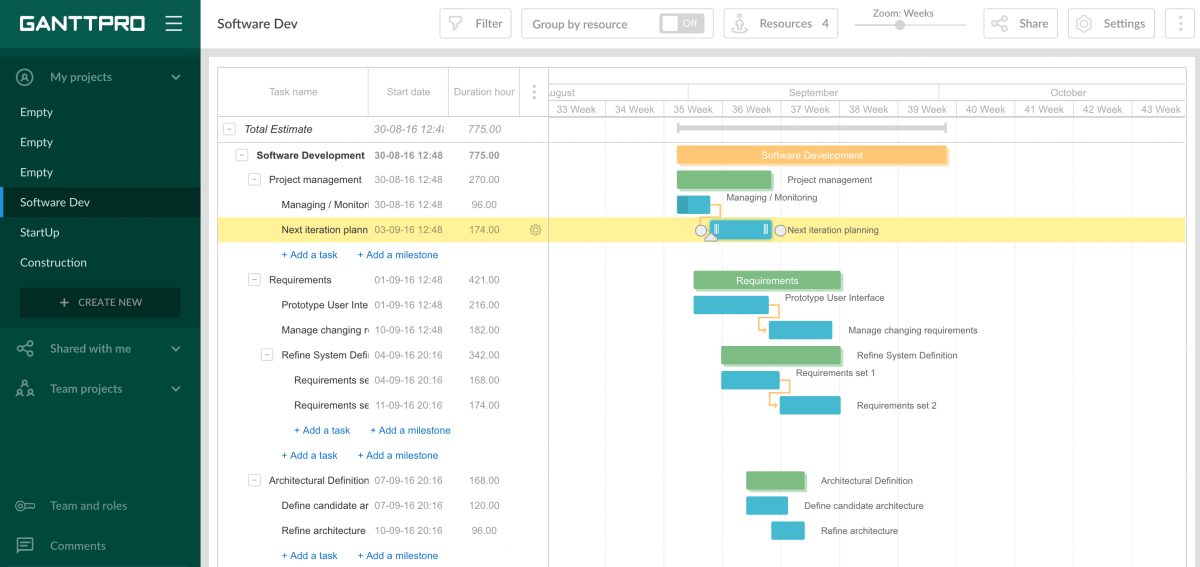
The name of this application writes itself: it is a specific tool for working in accordance with useful possibilities of Gantt chart planning. There specialists can create multiple workspaces and manage different working teams. Also, in GanttPRO every user can edit tasks, correct their terms and dependencies on the chart, manage resources and send every chart in the form of presentation. It is a serious application for a serious work, but the operation is very clear and understandable.
Gantt chart software #4 – Hygger
Of course, we also would like to note such Hygger’s function as roadmaps – it is the prototype of Gantt chart with its main components and purposes of use. Here is a typical technology roadmap in Hygger – look at the screenshot below:
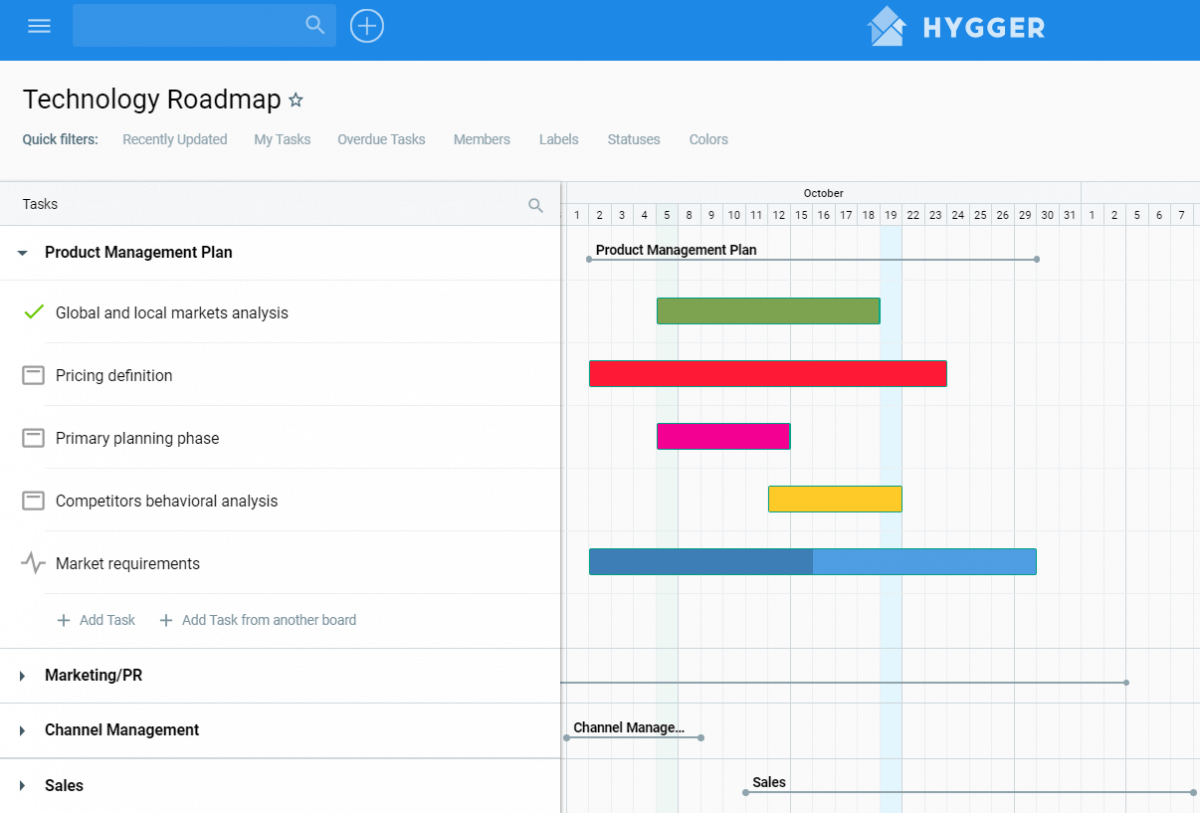
As it can be seen, there is a common Gantt chart – a clear diagram with tasks, terms of their execution and some related subtasks inside each task (like checklists, comments, etc.). Every roadmap is like a young brother of Gantt chart, and that is not bad!
Conclusion
Today we have managed with the challenge to tell about Gantt chart and describe every particular aspect of its creation and use. To sum up, it is better to add that Gantt chart can be a great helper not only in business planning but also in everyone’s ordinary life when it is necessary to make up a certain plan to buy, cumulate or repair something in the house.
We would like to know about your personal experience with planning by means of Gantt chart – please tell us about it in the comments of the article!


