Gantt Charts
How Gantt charts help in managing Agile projects
Browse topics
Agile project management can be compared with juggling numerous balls when managers and their teams are constantly juggling between tasks and projects. In this “game”, it is critical to always be on the alert because, if you miss a ball, everything can go wrong.
Deadlines are important. When you miss them, your planning can go haywire, and your project may have serious repercussions. Therefore, you must care about proper visual planning and scheduling of projects. This is where Gantt charts come to play the main role.

Online Gantt charts are widely used by project managers and other specialists from all walks of life. They help to plan, organize and deliver.
If you want to know in detail how your team can benefit from Gantt diagrams, you’ve come to the right place.
What is meant by a Gantt chart? What should be included in a Gantt chart? Is a Gantt chart a project plan? When should the chart not be used? You probably have some more questions, so let’s not waste time and dive into the subject right now and here, starting with the Gantt chart definition.
What Is a Gantt Chart?
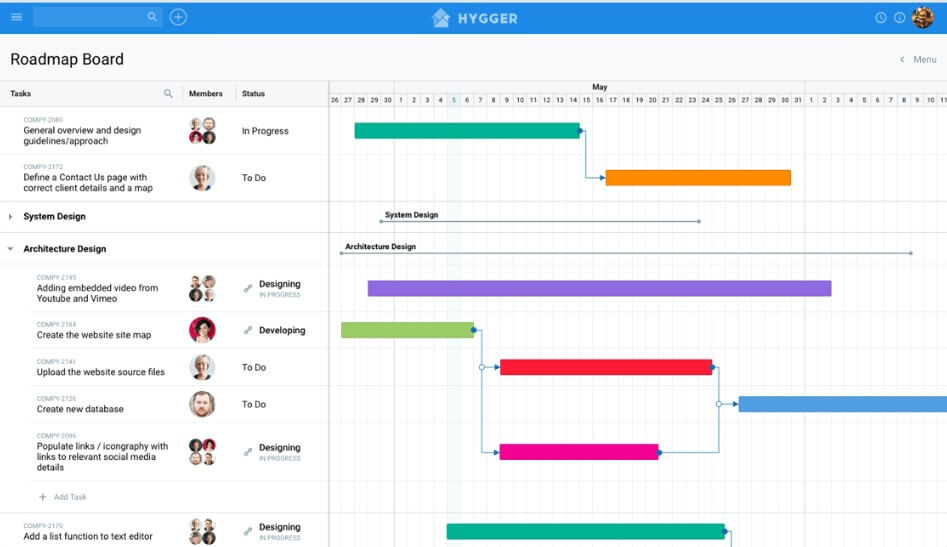
A Gantt chart is a reliable helper of project managers. This tool assists them in planning and scheduling projects of all sizes, especially for simplifying complex projects. The Gantt Chart represents a timeline where tasks are converted into a horizontal bar diagram, which shows start and end dates, dependencies, deadlines, and schedules. It also includes the info about how much of the task is completed per each stage and who is the task owner.
Gantt Charts are useful to keep tasks on track when you have a large team and many stakeholders.
What Else Can We See on a Gantt Chart Example?
- What the project tasks are.
- Who works on every single task.
- When tasks start and finish.
- How tasks link with each other.
- How long each task will take.
- The finish date of the project.
Gantt Charts Basic Terms and Elements
What are the elements of a simple scheduling chart? In order to make a Gantt chart work, different elements come together. Here they are:
- Timeline is a horizontal line across the chart’s top that shows days, weeks, months, and years.
- Bars are horizontal markers on the right side of the Gantt chart. They serve for visualizing tasks, their duration, progress, and start/end dates.
- Tasklist is a list of tasks that runs vertically down the left of the Gantt diagram to describe project work. It can be organized into groups and subgroups.
- Dateline is a vertical line that highlights the current date on the chart system.
- Milestones call out major dates, events, important decisions, and deliverables.
- Dependencies are the lines that connect tasks that need to happen in a certain order.
- Progress demonstrates how far along work is. The progress can be indicated by percent complete or bar shading.
The Origins: What Should We Know About the History of Gantt Charts?
A Gantt Chart as a project management planning solution was described at the beginning of the last century by American engineer Henry Gantt. However, he was not the only one who first had the idea of project planning on bar charts. Karol Adamiecki, a polish professor and engineer, first mentioned this kind of chart in 1896. He came up with the idea of visualizing important processes and progress to see and better understand production schedules (his business was related to the steel industry). Adamiecki published his articles related to charts in Polish and Russian, so the world didn’t know much about this creative PM tool.
“Harmonogram” was the first name of a simple Gantt chart. Then they became actively used in various fields like construction, engineering, transport, project management, and other areas where clear work planning matters.
Nowadays, Gantt diagrams serve as a graphical method of planning different tasks and activities. They are quite simple and understandable with their horizontal lines, axes, and proposed terms. The charts help people to be productive in work planning and goal setting. Their structure allows describing the necessary tasks and setting up the desired goals in order to see not only the current work scope but also the sequence of tasks.
Is Gantt free?
Before starting to use handy Gantt Charts software (that is most likely not free) you can try to plan your project on paper. Yes, this is not a joke.
Use simple magnetic blocks or colorful pens – they were popular for Gantt planning some time ago. This is a free way to create your simple Gantt chart templates.
Essence And Purpose: What Is a Gantt Chart Used For?
There are three main reasons why experienced project managers use Gantt charts:
1. Creating and managing comprehensive projects
With the help of a Gantt diagram, PMs can visualize the building blocks of their projects and organize them into smaller, more manageable tasks. These small tasks are easily scheduled on the Gantt timeline, together with dependencies and milestones.
2. Defining logistics issues and task dependencies
You may also apply Gantt charts to track the logistics of your project. Task dependencies will guarantee that a new task can only start once another task is complete. When your task is delayed, then dependent issues will be rescheduled automatically.
3. Tracking project progress
You can track the “health” of your projects and make possible adjustments as teams log time towards issues in your plan. The diagram may contain release dates, milestones, or other important Agile metrics to track the progress of the project.
What Are the Advantages of Gantt Charts?
Scheduling charts are really appreciated throughout the whole project management world. This tool simplifies creating complicated plans, especially those that involve changing deadlines and multiple teams.
Online Gantt chart software helps Agile teams to plan work around deadlines and properly allocate resources. It provides a bird’ eye view of various projects in different spheres and industries. Modern Gantt chart systems with powerful digital roadmaps synthesize information and illustrate how choices impact deadlines.
How Can Gantt Charts Benefit You as a Project Manager?
1.You will know what’s going on in your projects
All in a single place. The diagrams will provide the total overview of the project and tell you about the critical info (such as members involved in each step, the order of tasks, duration, etc.).
2. It will improve team communication and cohesion
Project managers use Gantt charts to know who is working on what and give inputs on certain tasks and pass relevant info to them.
3. You will avoid resource overloading
With Gantt charts, you will properly use your resources, as you will get to see a project’s timeline where you will see how and where resources are being utilized.
4. You will be able to measure the progress of projects
The feature of measuring a project’s progress will enable you to make changes in the project strategy if it is lagging behind the schedule.
5. You will timely define overlapping activities
When you see an overview of projects using a Gantt chart tool, you can easily recognize which tasks are dependent on each other and schedule them in a way that they do not affect the overall progress.
6. You will get more clarity
Gantt charts will let you see things with a lot more clarity with just a click. More clarity means better understanding that in turn means successful completion of your project.
7. You will be able to practice better time management
Gantt chart software is one of the best tools to understand the severity of time delays while managing projects.
8. You will boost remote team activities
When you manage a project with a distributed team, you may have more difficulties in coordinating and keeping everyone in the loop. Scheduling charts will make it easier for everyone to stay on the same page while working together.
9. You will boost team flexibility
Agile teams should be prepared for the possibility that they might have to adjust their expectations as per the changing situations. A robust Gantt chart tool will help to avoid potential headaches in such conditions.
10. You will improve transparency in the workplace
Gantt charts will visualize the details of each team member’s tasks and milestones in one place. Everyone will be aware of each other’s workload and help those who may be struggling to fulfill their own work.
Are There Any Disadvantages of Using Gantt Charts?
If you’re a first-time project manager without experience, these diagrams can be pretty complicated. You should remember that they have to be constantly updated by you or your colleagues in order to stay relevant and accurate. If your organization is not used to managing work with Gantt charts, it’ll take some time to get everyone on board.
Additionally, Gantt charts provide a high-level overview of your scheduled tasks, but you can not see all of your tasks and their details at once. Finally, it’s quite difficult to track the amount of work and sub-tasks through the charts.
How to Use Gantt Charts in Your Project?
Let’s define five ways of using Gantt charts for your projects:
1. For brainstorming your workflow
Simplicity and visual nature are the most evident advantages of using Gantt charts as a project planning tool. You can use them to visualize various project scenarios and adjust workflows and resources accordingly.
In case your team has some troubles with brainstorming Agile workflow, Gantt chart templates can be used as a launchpad, then customized to best suit your project needs.
2. For determining the critical path
The critical path method (CPM) will be helpful when you’re striving to find the most efficient way to move from project kickoff to completion. CPM is used to define the quickest route to complete a project by recognizing the longest stretch of dependent activities. Gantt charts will help you to visually track project dependencies and calculate the total time every path will take to complete.
3. For setting deadlines
Scheduling or rescheduling tasks for a project on your Gantt graph is a good habit for project managers. They can see how even tiny schedule changes may affect the overall timing of the entire project.
4. For splitting projects into small tasks
Agile teams break down an unmanageable project into smaller tasks, which they can complete in shorter work sprints. With the help of Gantt charts, you split large projects into smaller ones so as to delegate and share responsibilities.
5. For tracking the progress in projects
Gantt chart tools allow tracking the live progress of Agile projects by drilling down into individual tasks. The diagram changes as people complete their parts of the job on time or past their due date. It demonstrates how the project is progressing as compared to the initial timeline.
Creating a Sample Gantt chart: User Manual in 3 Simple Steps
Despite their simplicity, Gantt charts have specific components that are executed for the best work results. Follow the next steps to succeed in this way:
1.Define a goal and divide the work into tasks
All should start with creating a table with the original data. Before building a Gantt chart itself, structure all your activities and make required prioritization manipulations. As a result, you’ll have a real to-do list that will turn into a visual chart.
2. Indicate time for every single task separately
The tasks in the table should have their timing or approximate terms of execution. You must note it, as Gantt charts welcome accuracy and logic in work planning.
3. Place all data into the Gantt graph structure
Now all the work tasks with time and order of execution should be embedded into the view of your Gantt chart. The tasks will be presented in the form of horizontal lines, and the vertical axes will imply the periods for the execution of each task and the whole work scope.
Who Should Use Gantt Charts?
Everyone who strives to visualize their tasks can utilize Gantt Charts.
Difficult processes are performed by computer algorithms, so you can just create a simple task list and add start and end dates. And that’s it. The diagrams will simplify your work if you are:
- CEO/CTO
- Product owner
- Project manager
- Product manager
- Team leader
- Marketing manager
- Scheduling manager
- Operations manager, etc.
Many think that a Gantt chart is the exclusive tool for formally trained IT PMs. That’s not true as today you may find this tool in working arsenals in other areas:
- IT
- Construction
- Architecture
- Finance
- Marketing
- Education
- Healthcare
- Telecommunication
- Governmental offices
Gantt Charts Software
Experienced project managers know exactly that they can significantly save time and resources by creating Gantt Charts using some computer opportunities.
Create Your Own Gantt Chart
The simplest way is to use Microsoft Excel. The program offers a bar chart feature, so you can format it to get an Excel Gantt chart example:
- List your project schedule in an Excel table. Place each task in a separate row and structure the plan by including the start and end dates and duration.
- Based on start dates, set it as a standard bar chart.
- Add tasks duration.
- Add task descriptions to the Gantt graph.
- Transform the bar graph into the Excel Gantt schedule using the formatting feature.
You may also use Microsoft Project or any other simple online Gantt chart tool to build shareable and collaborative plans and schedules.
The online approach in Gantt project management preaches ease of sharing and collaborative planning. Anyone in your team can see the project plan, update their tasks, and attach files. This is where Hygger.io looks like one of the most reliable and multifunctional tools. Hygger roadmaps are designed based on handy Gantt charts, that is why the tool is appreciated among project management and product management teams all over the world.
Is Online Gantt Chart Software Secure?
People often doubt the pros and cons of online Gantt chart software and compare it with desktop equivalents. They logically worry about the security of their online project plans.
Most companies today offer bank-level security and encryption with online project management tools and have numerous security protocols in place to secure data and data recovery.
Conclusion
Being a project manager, you count every minute. So there is no need to waste time creating a bunch of complicated spreadsheets just to keep tabs on your project.
Friendly Gantt charts will help you to stay focused on the tasks that move the needle. Use any reliable Gantt schedule software to whip up a project plan in minutes, and watch your team cross the finish line faster.
Now, what does a Gantt chart tell you? How do you create a Gantt chart for a project? How do you organize a Gantt chart in your team? Hopefully, now you can confidently answer these questions and work with the charts efficiently.