Kanban Metrics
The list of the most essential Kanban reporting metrics
Browse topics
Project management has many challenging aspects. One of them is guiding multiple projects in the right direction. For many, this looks like fighting a hard battle to keep up with the ever-changing workflow across projects. Luckily, a visual and collaborative approach known as Kanban simplifies things and shows the way to avoid a constant struggle.
How to incorporate Kanban into your project management initiatives? What is Kanban analysis? What is a typical measurement in Kanban? How do I track my Kanban progress? So many questions… We have to deal with them right now.
In this post, we describe the top Kanban reporting metrics for tracking progress as well as how you can utilize them.
Get Started with the Kanban Approach
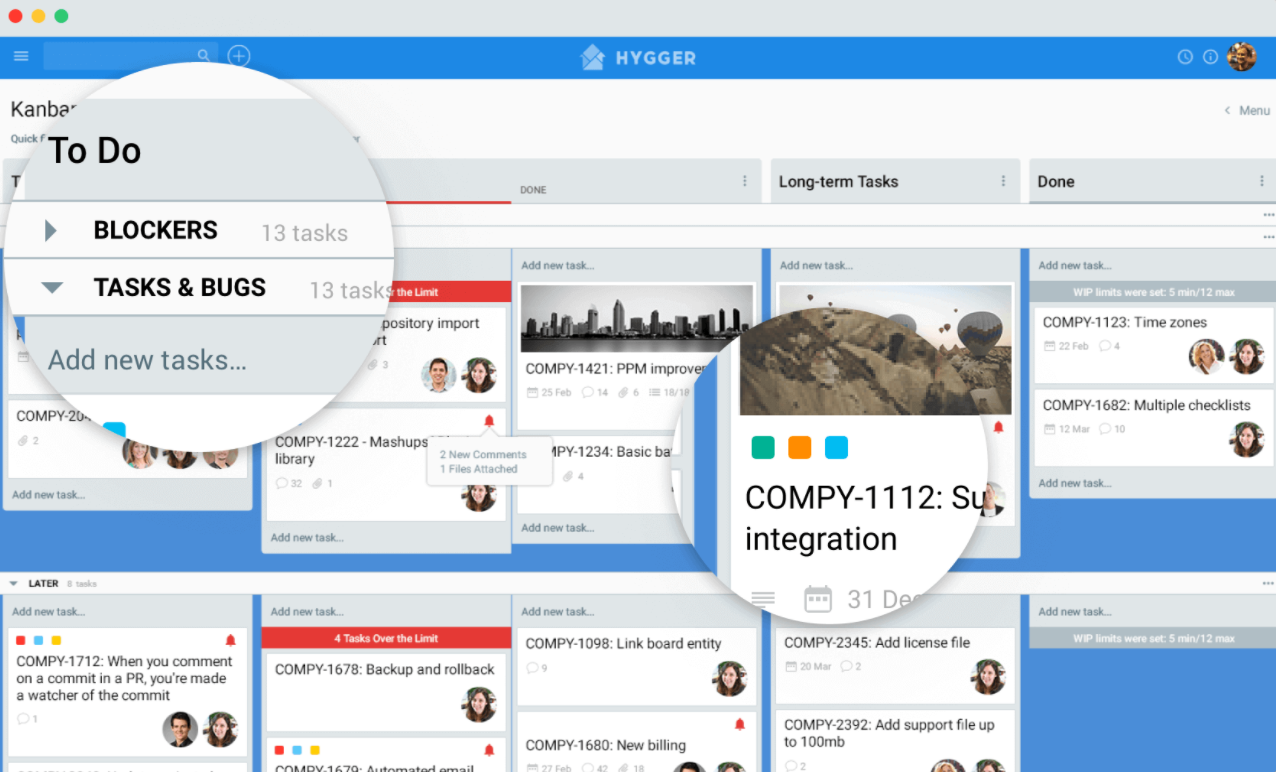
Before you start using the Agile Kanban methodology to collaborate with your team members from different departments, you need to set up a digital Kanban board and share the access with your team members. Then you can invite various participants and assign them to a project.
Applying handy Kanban boards, you’ll get the following benefits:
- A visual representation of the progress made on projects.
- The ability to create and assign subtasks within a project.
- A place for discussing your projects, problem-solving, and brainstorming.
Dive deeper into the Kanban concept, reading our guide.
Nowadays online Kanban boards are gaining popularity with project managers engaged in large-scale projects. Boards provide them with valuable information about multiple tasks and teams.
This is the point where we should logically mention essential Kanban metrics as they are critical for quick progress assessment and decision-making.
What Are Kanban Metrics?
If you are going to invest in a powerful Kanban board software, try to select one that tracks metrics and generates reports. Most Kanban-focused tools created for enterprise-level project management offer this functionality.
So what are the key Kanban board metrics?
Good and Bad Metrics: What Does It Mean?
There are good and bad metrics, and you should be able to differentiate them so as not to get trapped by the bad ones. In simple words, metrics are good if they help to improve the system. If they reward or punish individuals, they are bad.
Metrics are Good if they:
- Are actionable and improve the decision-making process
- Lead to better results
- Portray the state of reality
- Improve behavior
Bad metrics:
- Are focused on the past
- Often lead to bad results
- Are used as targets
Let’s focus on the good Kanban tracking metrics and how to make the best of them.
Here we will briefly describe the following metrics:
- Burndown chart
- Lead and Cycle time chart
- Cumulative flow chart
- Throughput
- Work in progress
- Team performance
- Queues
- Bottlenecks
- Time tracking
Top-3 Kanban Metrics for Tracking Progress

1. Burndown Chart
The burndown chart is one of the most important metrics that every project manager using Kanban should track. The chart gives you a visual representation of the number of tasks planned and the number of tasks completed within a particular Kanban board. It also helps to predict future performance by indicating when project tasks will be finished if the team keeps progressing at the same pace.
2. Lead and Cycle Time Chart
This essential Kanban metric allows seeing the average number of days that your tasks take during a specific time period. The metric will help you to look at the entire project cycle or between any two custom points of time during the lifecycle.
The Lead and Cycle time chart is aimed to help you better understand the following info about your projects:
- Project efficiency
- Bottlenecks
- The speed of completing a project
How is Average Lead Time Measured in a Kanban System?
Another relevant question is: How do you measure cycle time in Kanban? To measure Lead time and Cycle time, you may use a CFD diagram (Cumulative flow), one of the most advanced data sources for your workflow. It will demonstrate the average Cycle time and Lead time, as well as the number of work-in-progress items.
3. Cumulative Flow Chart
This Kanban metric demonstrates an aggregated view of your project cards, which are arranged in the Planned, Working on, and Done categories. The cumulative flow chart looks useful for assessing the overall success of a project by giving the manager a visual representation of:
- The number of completed assignments.
- The tasks that the team is currently working on.
- The tasks waiting to be started.
Along with measuring performance, the metric is also helpful for managers who make informed decisions when delegating tasks, especially when working on complex projects with many departments.
This lets them see which teams are more effective at performing specific tasks.

What Are the Other Kanban Metrics We Should Focus On?
4. Throughput
Throughput in Kanban measures the total amount of work delivered in a certain time period. The metric only measures completed work items (nothing that is still in progress gets counted).
Kanban throughput is also an essential metric (together with the three above) and it can be used to measure the capacity to deliver results. You may apply the throughput metric over time to track your team performance using the throughput histogram.
It will help you to realize how frequently your team achieves a certain throughput over a period of time. Therefore, throughput metrics assist to see how your team’s overall performance is changing. Ideally, it should stay the same or increase.
How is Kanban Throughput Calculated?
A throughput histogram will be helpful if you want to see the average throughput per day or what percentage of all days you reached a certain throughput. It will give you a better understanding of your team’s capacity.
5. Work in Progress
Another core component of Kanban is limiting work in progress (WIP limits) so as to improve the team’s efficiency. You have to choose whether you split your attention between many tasks or whether you focus on only one task.
The ideal WIP limit for your team will depend on some factors, for example, the size of your team. However, first, try to set limits around the number of people in your team to let everyone focus on one task at a time.
6. Team Performance
Cycle times and throughput are the two Kanban metrics that measure your team performance best of all. You should pay attention to them to make sure you are delivering results to your clients.
There is a special law, Little’s Law, which connects cycle time, throughput, and WIP limiting:
Cycle Time = WIP/Throughput
It demonstrates the relationship between these metrics, claiming that changing one will have an effect on the other two.
7. Queues
Queues (the cost of waiting) may appear in the flow of work while tasks await further action. A queue stage can be ”waiting for review”.
Queues may accumulate a major part of tasks’ cycle time. It can happen because work items are interrelated and depend on different people in the team. Therefore, it is critical to monitor queues and understand how they may impact your performance. What you can do is to limit the number of items in queues and try to move them faster. Remember that the more time work tasks spend in queues, the higher the costs.
In order to analyze queues, you may apply the Heat Map that will show how long your tasks have in each stage of your workflow. So, you’ll be able to see the total amount of time items in queues reside in a predefined time frame.
8. Bottlenecks
Process bottlenecks are the factors that your performance is about to suffer. They signal that there is no resource capacity in your team to handle the amount of work assigned to them in a timely manner.
Try to spot bottlenecks as they occur. Pay attention to increasing cycle times and decreasing throughput. When you identify a bottleneck, take a close look at why this could be occurring. By taking action quickly, you will eliminate bottlenecks before they become a problem.
9. Time Tracking
This metric provides insight into the time usage of each team member or the whole team. Time tracking informs on how much time the team had spent on each task. You may generate this report for all of your Kanban boards together. It will offer a summary and a detailed view.
Final Thoughts
Kanban metrics are valuable assets for your Agile Kanban team. The main thing is to focus on the metrics that will improve your processes and make everyone’s lives a lot better. They are aimed to remove obstacles and allow teams to achieve maximum efficiency. What do you think about Kanban metrics? Do you have your favorites?