

How Do Gantt Charts Make Project Managers’ Life Easier?

Most project managers are aware of Gantt Charts that help them to increase productivity and efficiency and ensure that tasks and projects are completed on time.
The charts can be applied to small projects and complex ones.
What are the secrets that make the charts a powerful tool in project management?
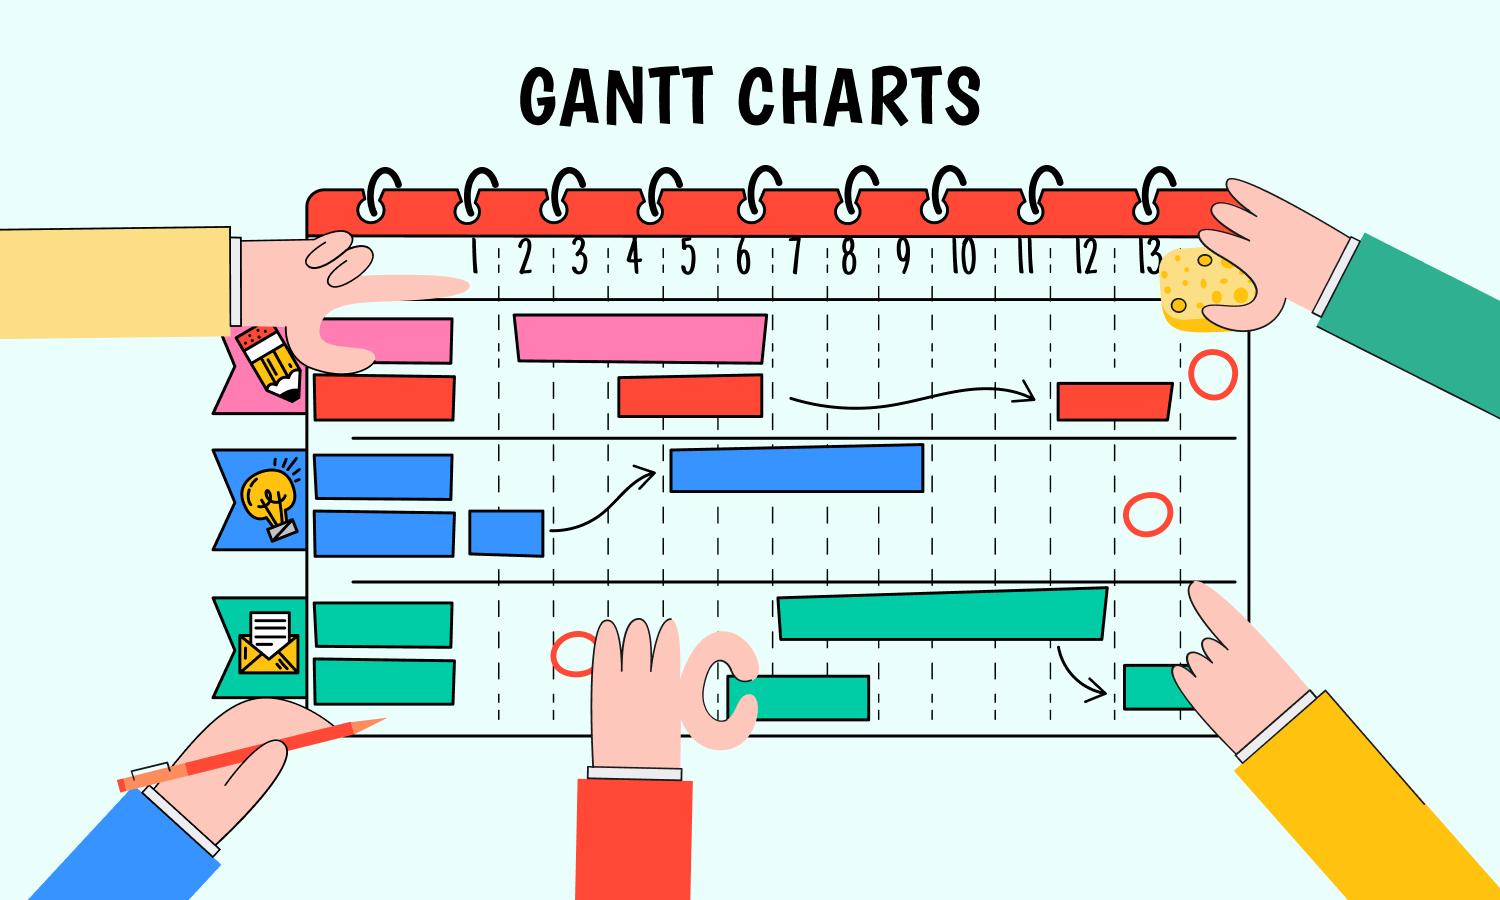
What is a Gantt Chart?
A Gantt chart is a visual way to view scheduled tasks. The charts are widely used for planning projects of all sizes in different industries and spheres. It’s a useful way of showing what work is scheduled to be done on a specific day and time. Gantt Charts also help teams, PMs, and those who are dreaming of how to become a project manager to view the start and end dates of any project. All in one simple view.
Historical background
Gantt charts were named after Henry Gantt. People often think that he was the one who first had the idea of project planning on bar charts.
However, it was a polish engineer Karol Adamiecki who first devised the “Gantt” chart in 1896.
Professor Adamiecki came up with the idea of displaying processes and progress visually to make it easier to see production schedules. Most of his researches was connected with the steel industry.
By the way, the first “Gantt” chart was named as the harmonogram.
The professor published his articles about it in Polish and Russian. That’s why the world didn’t know much about these charts.
Henry Gantt came to the same idea about 15 years later. He started a visual planning with bar charts in 1910 to allow supervisors to see if production was on track or behind schedule. Thus, these charts received a name in honor of Henry Gantt.
What was before?
Before starting to use comfortable Gantt Charts, people planned their projects on paper. Yes, and it’s not about the Stone Age 🙂
Magnetic blocks and colorful pens were quite popular for Gantt planning. Then advanced Gantt Chart software were developed. Nowadays you may find a lot of such tools and platforms but they’ll be described below.
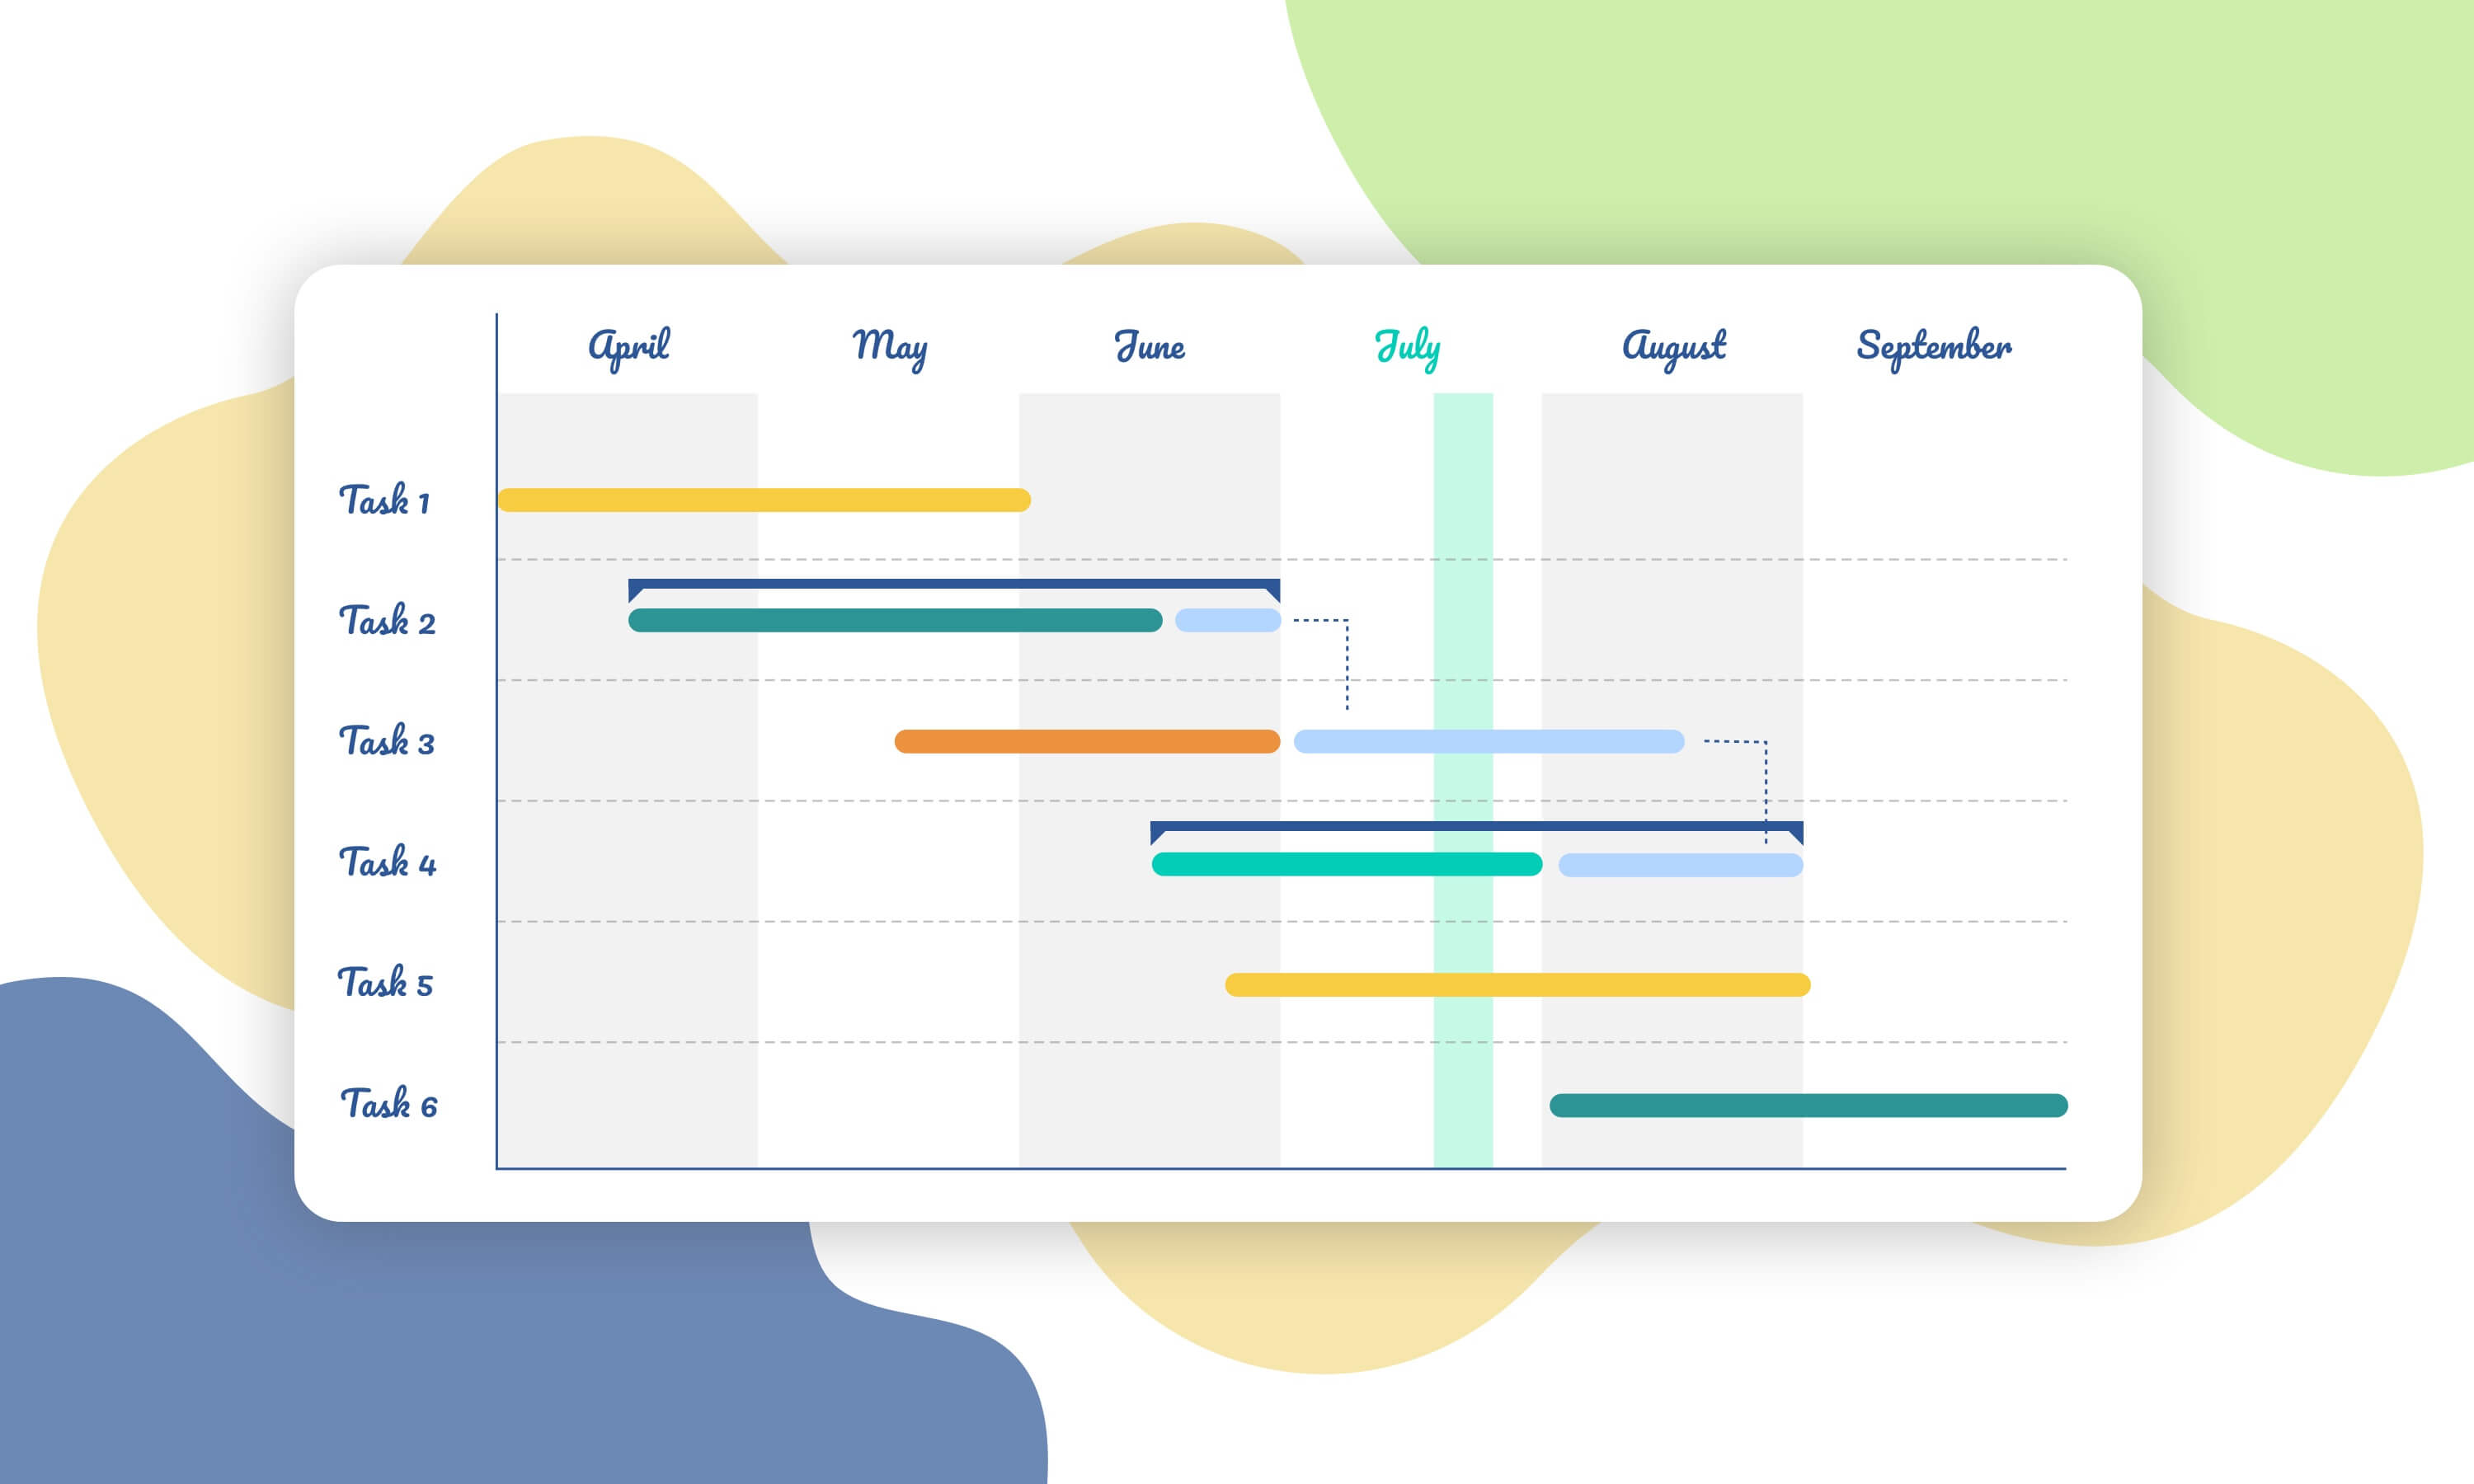
What can you see and recognize with Gantt Charts?
- What tasks the project includes
- The start date and the finish date of any project
- Tasks duration: when they start and finish
- How long will each task take?
- Who is working on every single task?
- How tasks group together
Gantt Charts for everybody
Gantt Charts can be easily used almost by everyone who wants to visualize their tasks.
All difficult processes are done by computer algorithms, so anyone can just create a simple task list and add start and end dates.
Actually, Gantt Charts may be effective tools for the following roles:
- CEOs and CTOs
- Project managers
- Product managers
- Product owners
- Team leaders
- Marketing managers
- Operations managers
- Scheduling managers, etc.
Many of us used to think that Gantt Charts are the exclusive tool for formally trained IT project managers. That’s right. However today you may find Gantt Charts in working arsenals in other areas.
As Gantt Charts are easy to build, they can be used for almost any project. Here’re the most popular spheres where the charts are applied:
- Construction
- IT
- Marketing
- Finance
- Education
- Architectural Teams
- Telecommunication
- Healthcare
- Government teams
The easiest ways to create a Gantt Chart
You may easily build your Gantt Charts even with a sheet of paper:
- Combine all your tasks in a list. Highlight the start date and the estimated duration for every task.
- Create graphs with the days or week.
- Put your tasks onto the graph paper. Define the earliest possible start dates. Draw bars and mark the time taken to complete them.
- Schedule. Your dependent activities should not start until the tasks they depend on have been completed. Gantt charts will help you to find out critical paths, prioritize objectives and apply WBS (work breakdown structure). If your project is big and consists of many tasks, be sure to set all dependencies in a right way, otherwise, it may look really complicated 🙂
- Share project objectives with your team members if needed. And that’s it!
- Finally, analyze your project.
You may also create Gantt Charts using Excel. People use Excel in companies all over the world in different ways and for tracking massive projects as well.
Gantt Charts software
One day project managers found that they could save time and resources in creating and updating their Gantt Charts using some computer opportunities.
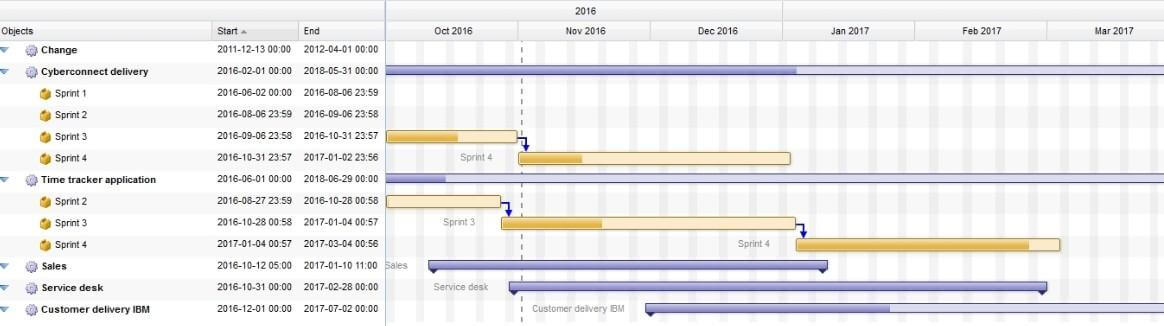
Gantt Chart software is associated with project planning, project management, and project scheduling software. The services were created to automate the processes, to create task dependencies, add milestones, identify the critical paths, etc.
Today you may use a local desktop program like Microsoft Project or any powerful online Gantt Chart software to create shareable and collaborative Gantt Charts and plans.
The online approach in Gantt Chart project management supports ease of sharing and collaborative project planning. Any team member can see your project plan and also update their tasks and attach files.
Here’re some of the popular online solutions:
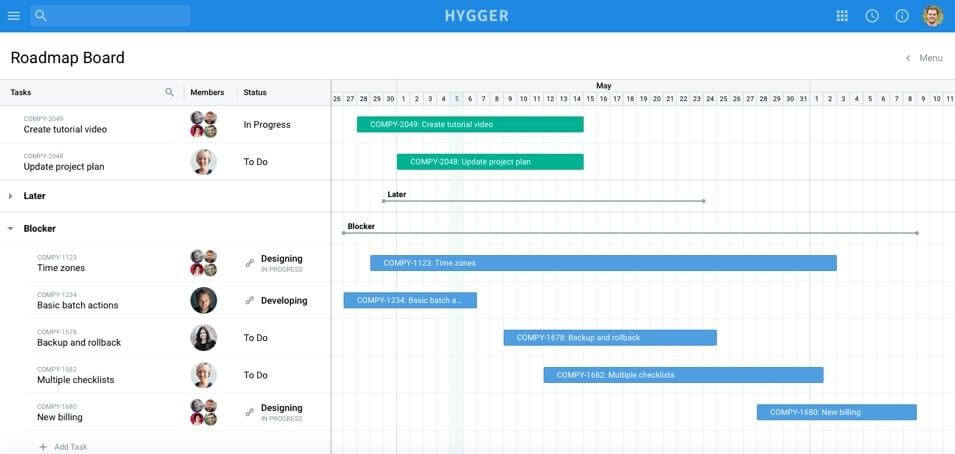
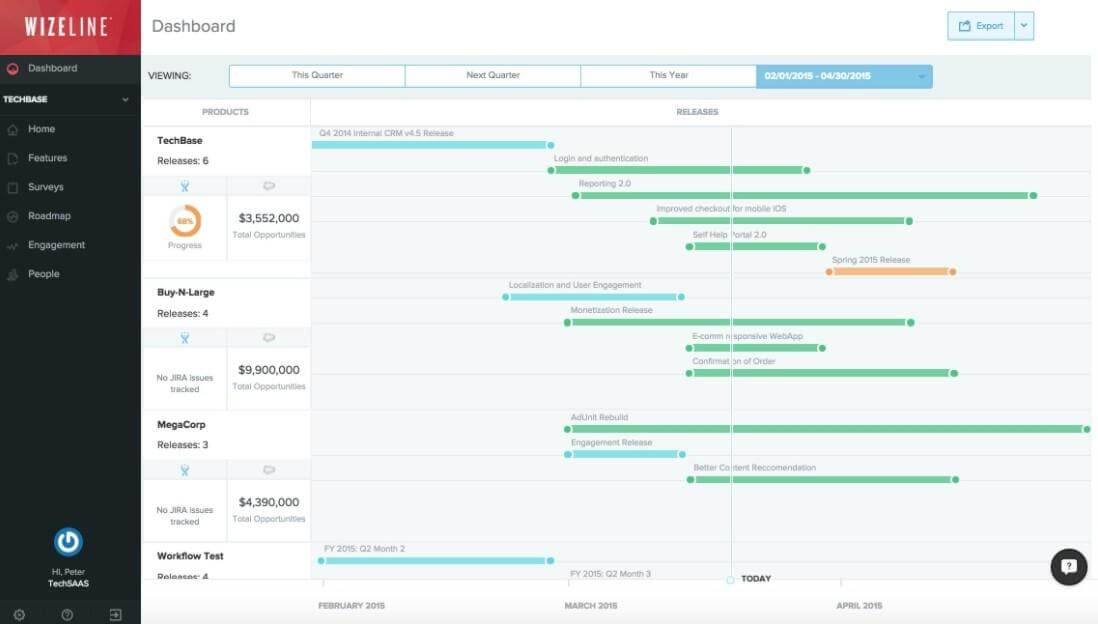
If recollect product management, we can see that the charts are actively used in designing roadmaps. Here are some examples of product roadmaps:
Hygger roadmap
Wizeline roadmap
Conclusion
In conclusion, we should answer one more important question: is online Gantt Chart software secure?
There are many debates about it. Be sure, most companies offer strong security and encryption with online PM software and have multiple security protocols in place to secure data.
To sum it up, let’s combine the key advantages of Gantt Charts and professional software:
- The charts visualize tasks and represent all stages of a project
- Help to identify the critical points
- Help to reduce schedule problems
- Can be easily updated with PM software and apps
- Can be built even with a paper or Excel
What software do you use for building Gantt Charts? Feel free to share it in the comments.