
Root Cause Analysis: Introduction and Tools

If you face some problems at work, you initially try to define and treat the symptoms that you see on the surface. However, it’s rather important to care about deeper causes that need your attention.
Fixing the symptoms is just a part of solving the problem. This problem will definitely return, and you will need to fix it repeatedly.
Deep analysis with the aim to figure out what’s causing the problem will help to fix the underlying processes to make it go away for good. In this case, Root Cause Analysis comes to assist. This method helps people to answer the question of why the problem occurred in the first place. In this post, we introduce this method to help you to find the primary causes of your work problems.
What is Root Cause Analysis?
What does root cause mean? Root cause analysis (RCA) is a technique of solving a problem at its source, but not just treating its symptoms. The term combines a collection of approaches used to identify the real cause of a non-conformance or quality problem. The method is definitely what you need if the problem you face is appearing again and again and you don/t understand the root cause.
Root cause analysis can be considered as part of a problem solving or decision-making process. You initially perform RCA to know which problem is the right one to solve.
The main goal of using the RCA method is to analyze problems to identify what happened and how it happened as well as to generate actions for preventing recurrence.

Why do we need to perform RCA?
Repeated problems mean waste in manufacturing. It is about product rework, machine downtime, increased scrap, etc. We often believe that the problem is resolved but in reality, we have just addressed its symptoms. The RCA method can identify breakdowns in your processes that contributed to the non-conformance and determine how to prevent it from happening again.
What are the benefits of root cause analysis?
Implementing RCA will help your company to:
- Timely identify problems’ causes and barriers to find permanent solutions.
- Identify needs for organizational improvement.
- Generate logical approaches to problem-solving.
- Establish step-by-step processes when a particular process can confirm the results of another one.

What are the RCA principles?
- Measuring root causes is more effective than treating the problem symptoms
- The RCA approach is performed most effectively if it is accomplished through a systematic process with conclusions and evidence.
- You typically face more than one root cause for a problem.
- The focus of the analysis is WHY the problem occurred, but not WHO made the error.
Examples where RCA is used
Here is the list of usual cases where RCA is applied to solve problems and provide preventive actions:
- Everyday incidents
- Human errors
- Risk analysis
- Major accidents
- Minor near-misses
- Maintenance problems
- Manufacturing mistakes
- Medical mistakes
- Productivity issues, etc.

How to Perform Root Cause Analysis?
There are many tools that you may use during a Root Cause Analysis. Some of them can be completed by one person, but in most cases, involving cross-functional teams provide the greatest benefits and increase the chances of reaching the true root cause. Let’s get more details about these tools.
Best Tools for Root Cause Analysis
1. The 5 Whys
The author of the method is Sakichi Toyoda, the “father” of the Japanese industrial revolution and founder of famous Toyota Industries.
The 5 Why technique is simply asking the question “Why” until you get through all the symptoms and the root cause of the defined problem. This method is broadly used during various problem-solving activities. You may also apply it in coordination with other analysis tools, for example, with the Cause and Effect Diagram.
5 Whys is most effective in case the answers come from people with hands-on experience of the issue being examined. Just keep asking “why” to discover the root cause of your current problem. By repeating this, you will be able to drive down to the root cause.
The 5 Why concept may have three separate areas to address the 5 Whys:
- why it occurred
- why it was not detected
- why our systems failed
You should explore every area to have more than one causal progression for each.
2. Pareto chart
A Pareto chart represents a bar or histogram chart that is combined with a line graph. It groups the cost or frequency of different problems to demonstrate their relative significance. The bars in the Pereto method demonstrate the frequency in descending order, while the line shows cumulative percentage or total as you move from left to right.
This chart is a report that combines the top seven categories of failed audit questions for a given facility. The layered process audits allow checking high-risk processes on a daily basis to verify conformance to standards. They identify process variations that cause defects.
So, the Pareto chart is a powerful reporting solution aimed to analyze LPA findings.
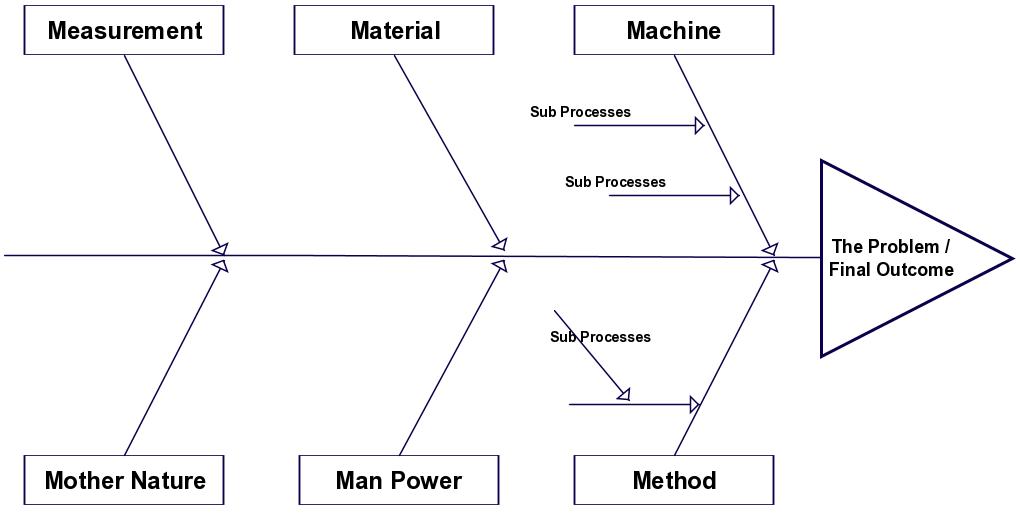
3. Ishikawa Diagram
The Ishikawa diagram is also widely known as the Fishbone Diagram. This is one more robust tool for determining the most likely causes of a quality problem.
Actually, the diagram is called a Fishbone Diagram because it looks like a skeleton of a fish where the problem is listed in a box at the end. The key sections of the diagram are used to address the 6Ms – Man, Material, Method, Machine, Measurement, and Mother Nature (Environment).
It is typically worked right to left. Every large “bone” is branching out and includes smaller bones with additional details. The important thing here is not to limit team members to brainstorm ideas.
After the brainstorming session, the team rates the potential causes in accordance with their level of importance and likelihood of contributing to the failure. Then they develop a hierarchy and select which causes to further investigate.
4. FMEA
FMEA means failure mode and effects analysis. This is a method used during the product or process design to explore potential failure or defects.
The concept includes a chart that outlines:
- potential causes, failures, and consequences.
- current means of control to prevent each type of failure.
- severity, occurrence, and detection ratings. They let you count a risk priority number for determining further action.
If you apply it to process analysis, the method is called PFMEA. process failure mode and effects analysis (PFMEA). Manufacturers often use the findings of this problem-solving approach to inform questions for process audits. They use it to reduce risk at the source.
5. Action Plan
The action plan contains appropriate countermeasures or corrective actions after your team has determined the root cause using any combination of the tools listed above.
These countermeasures can be divided into two categories:
- Immediate or short-term counter-measures that are generally accomplishable in less than 1 week.
- Permanent (long-term) counter-measures that are usually more complex. They may require additional resources and should be able to complete in less than 1 month.
All the actions must be clearly defined and achievable. The plan should also include expected due dates for every single corrective action.
You should apply the action plan to track the progress of individual action items required to complete the implementation of the countermeasures.
Where can I read more?
There are many useful books that can help you to get more details and examples related to using RCA the method. Here’s the list of the most popular books:
- Root Cause Analysis: Improving Performance for Bottom-Line Results, by Robert J. Latino and Kenneth C. Latino.
- Apollo Root Cause Analysis by Dean Gano.
- Root Cause Analysis Handbook by Risk and Reliability Division, ABS Group.
- Root Cause Analysis for Higher Education by Sherrie A. Tromp and Diana Warner.
- The Root Cause Analysis Handbook: A Simplified Approach to Identifying, Correcting, and Reporting Workplace Errors by M. Ammerman